


Assessing Risk-Adjusted Performance in Fine Wine

When people compare investments, the instinct is usually to look at one number: return.
That is understandable. Returns are easy to compare and easy to remember. But they rarely tell the full story. Two assets can deliver the same return over ten years while producing very different experiences along the way. One may rise steadily. The other may suffer deep losses before eventually recovering.
That difference matters. It affects behaviour, decision-making, and ultimately whether an investor is able to stay invested long enough to realise the outcome shown on a chart.
This is why, at WineFi, we look beyond headline performance and focus on how returns are achieved, not just how large they are.
The two charts shown here use risk-adjusted metrics to help explain that difference.
Chart 1: Sortino Ratio and Maximum Drawdown
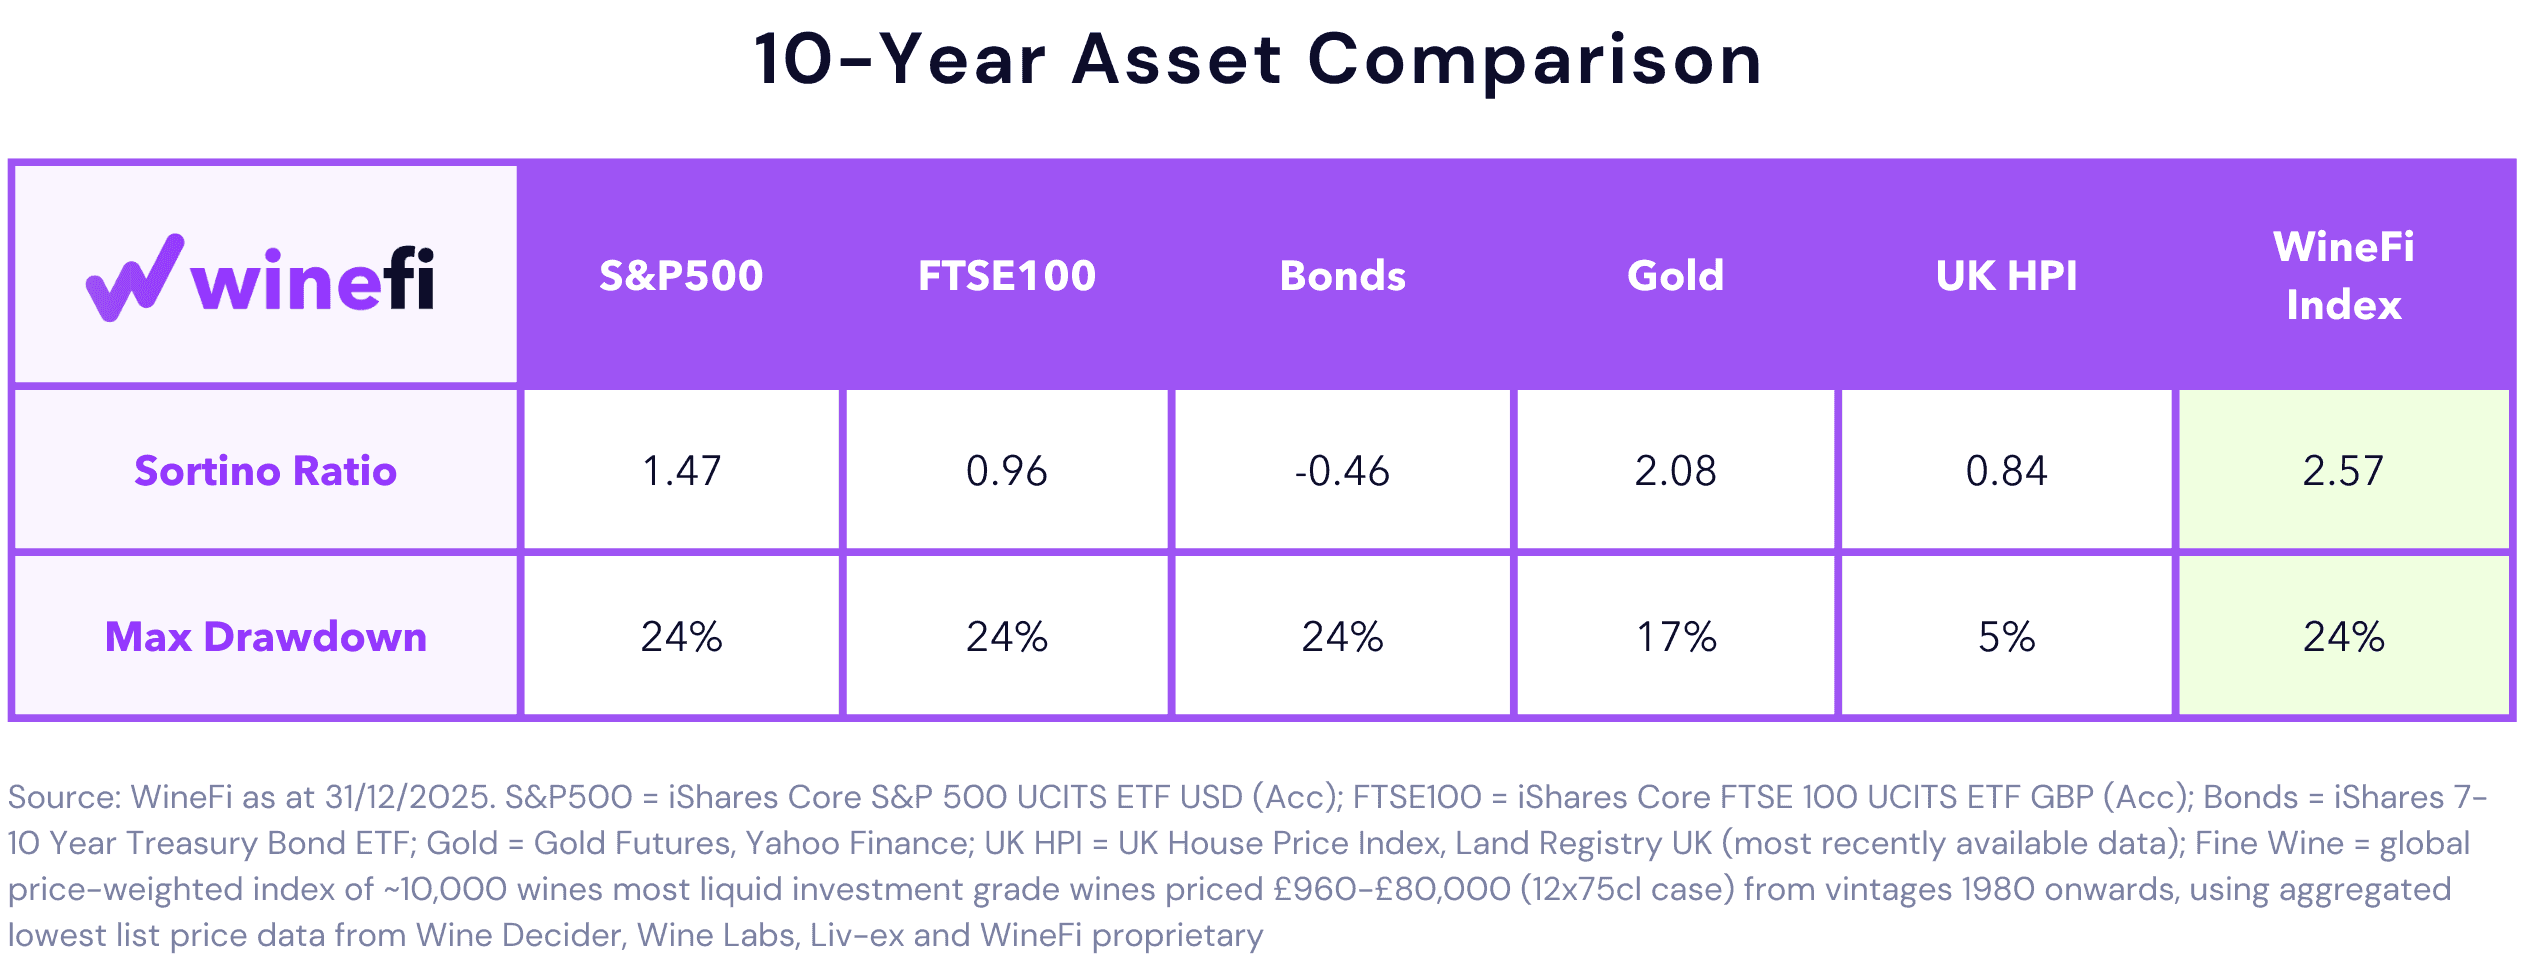
The first chart compares different asset classes using the Sortino Ratio, alongside maximum drawdown.
What the Sortino Ratio shows
Put simply:
A higher Sortino Ratio means better returns for the amount of downside risk experienced.
This distinction matters because investors are generally not concerned about prices moving up or fluctuating positively. What causes stress and poor decision-making are losses. The Sortino Ratio is designed to reflect that reality.
In the chart, fine wine compares favourably on this measure relative to several traditional asset classes. This reflects the fact that fine wine has historically exhibited a different pattern of risk, shaped by episodic pricing, constrained supply, and longer holding periods rather than daily market volatility.
This does not mean fine wine is low risk. It means the way risk shows up has historically been different.
What maximum drawdown shows
Maximum drawdown captures the worst peak-to-trough fall an investor would have experienced over the period shown.
This is important because it represents the most difficult moment to live through. An asset with strong long-term returns but deep drawdowns can be extremely challenging to hold, particularly during periods of market stress or tightening liquidity.
Looking at drawdowns alongside the Sortino Ratio helps explain not just how much an asset returned, but what an investor would have had to tolerate to achieve those returns.
Chart 2: Calmar Ratio, Returns, and Drawdowns
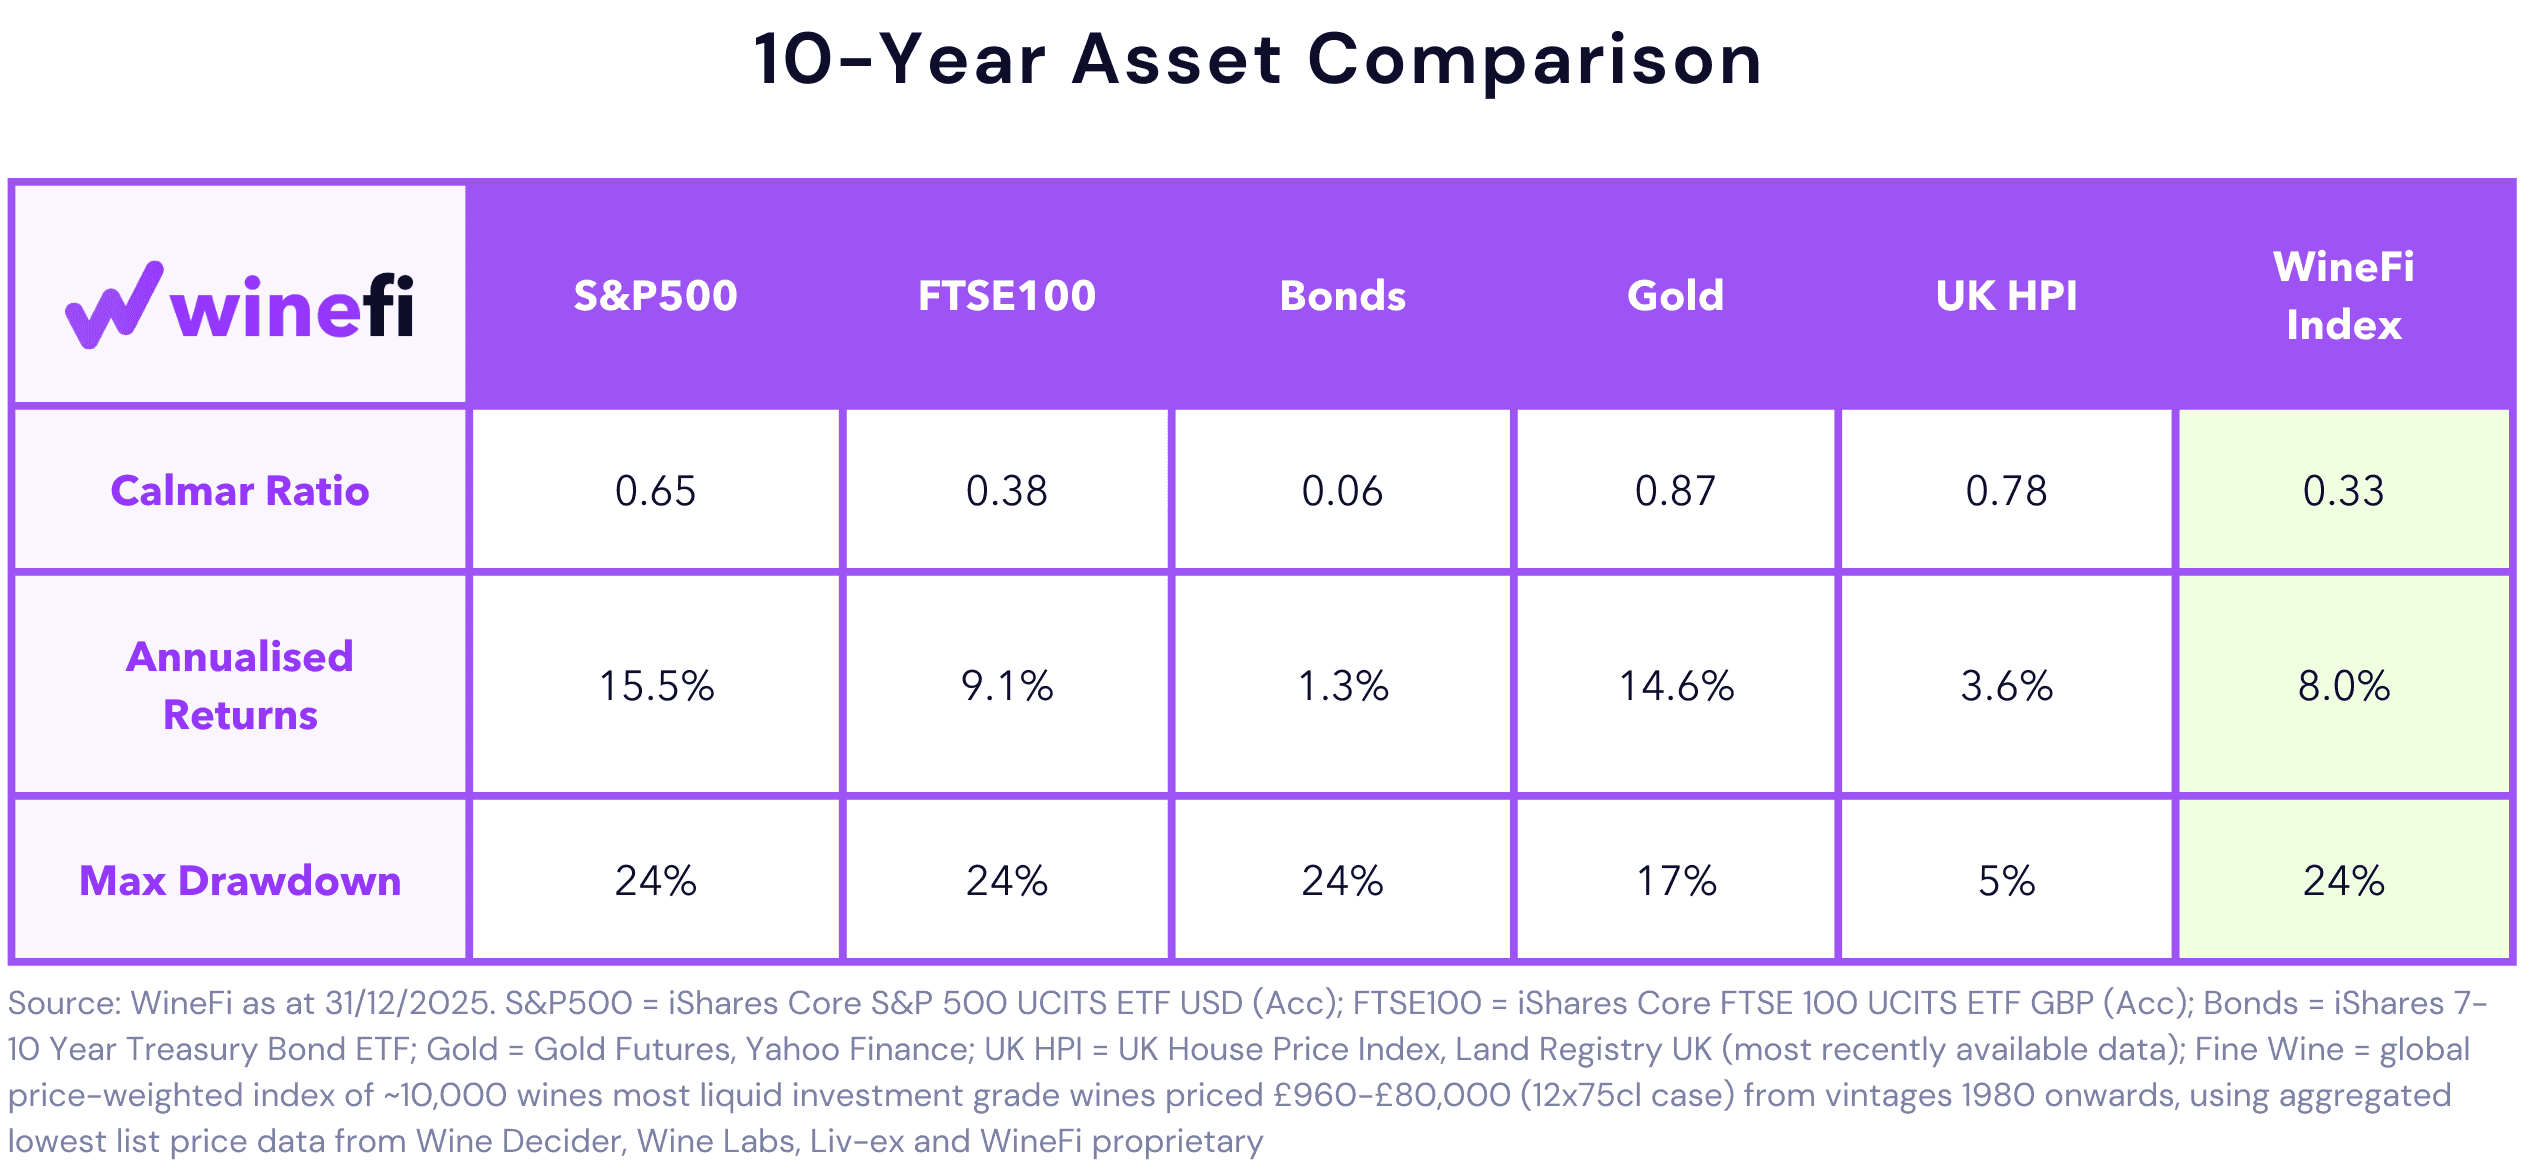
The second chart adds another layer by introducing the Calmar Ratio, alongside annualised returns and maximum drawdown.
What the Calmar Ratio shows
The Calmar Ratio compares an asset’s annual return to its worst historical drawdown.
In plain terms:
It shows how much return an asset generated for the largest loss an investor would have had to endure.
A higher Calmar Ratio indicates a more attractive balance between long-term returns and drawdowns. It does not remove risk, but it helps distinguish between assets that delivered returns efficiently and those that required investors to sit through significant losses.
In the chart, fine wine sits between growth assets such as equities and more defensive assets such as property or bonds. This reinforces an important point. Fine wine is not a replacement for equities, nor is it a cash-like asset. It behaves differently, with a risk profile shaped by scarcity, consumption, and liquidity rather than earnings or interest rates.
Why we do not rely on Sharpe Ratios
Many investors are already familiar with the Sharpe Ratio, which measures return relative to total volatility. It is widely used, well understood, and useful in many contexts.
However, Sharpe Ratios treat all volatility the same. They penalise positive price movement and negative price movement equally.
For assets like fine wine, this can be misleading. Fine wine prices tend to move infrequently and in steps. Periods of price stability are common, and upside movements often occur after long holding periods. Using a measure that penalises positive volatility can understate the quality of returns and overstate risk.
More importantly, most investors do not experience upside volatility as risk. What matters in practice is downside risk and drawdowns. That is why we prefer metrics like Sortino and Calmar, which focus specifically on losses and worst-case outcomes rather than total price movement.
Sharpe Ratios are not wrong. They are simply less informative for assets whose behaviour does not resemble continuously traded financial instruments.
Why WineFi uses these measures
Fine wine does not trade daily, does not generate income, and does not respond directly to interest rates or earnings cycles. Traditional volatility measures can therefore obscure more than they reveal.
Sortino and Calmar ratios help us:
Compare fine wine to other asset classes on a more meaningful basis
Focus on downside risk rather than short-term price noise
Put drawdowns into context rather than ignoring them
Frame wine as a long-term portfolio component rather than a trading asset
They are not prediction tools, and they do not eliminate risk. They help us think more clearly about the quality and durability of returns, not just their size.
An important caveat
These charts reflect historical, index-level data, not the experience of any individual investor. Returns in fine wine are highly dispersed, and outcomes depend on selection, entry price, liquidity, and holding period.
For that reason, we treat these metrics as context, not promises.
The bigger picture
At WineFi, our aim is to apply the same discipline used in professional asset management to fine wine. That means asking harder questions than “what did it return” and being honest about drawdowns, liquidity, and real-world investor experience.
The charts above are not designed to persuade. They are designed to explain how different assets behave, and where fine wine may, or may not, belong within a broader investment strategy.


Capital is at risk. Wine values can go down as well as up, and investments may not perform as expected. Returns may vary. You should not invest more than you can afford to lose. WineFi is not authorised by the Financial Conduct Authority. Investments are not regulated and you will have no access to the Financial Services Compensation Scheme (FSCS) or the Financial Ombudsman Service (FOS). Past performance and forecasts are not reliable indicators of future results and should not be relied on. Forecasts are based on WineFi’s own internal calculations and opinions and may change. Investments are illiquid. Once invested, you are committed for the full term. Tax treatment depends on individual circumstances and may change.
You are advised to obtain appropriate tax or investment advice where necessary.
WineFi is a trading name of WineFi Management Limited. Registered in England and Wales with registration number: 14864655 and whose registered office is at 5th Floor, 167-169 Great Portland Street, London, United Kingdom, W1W 5PF.